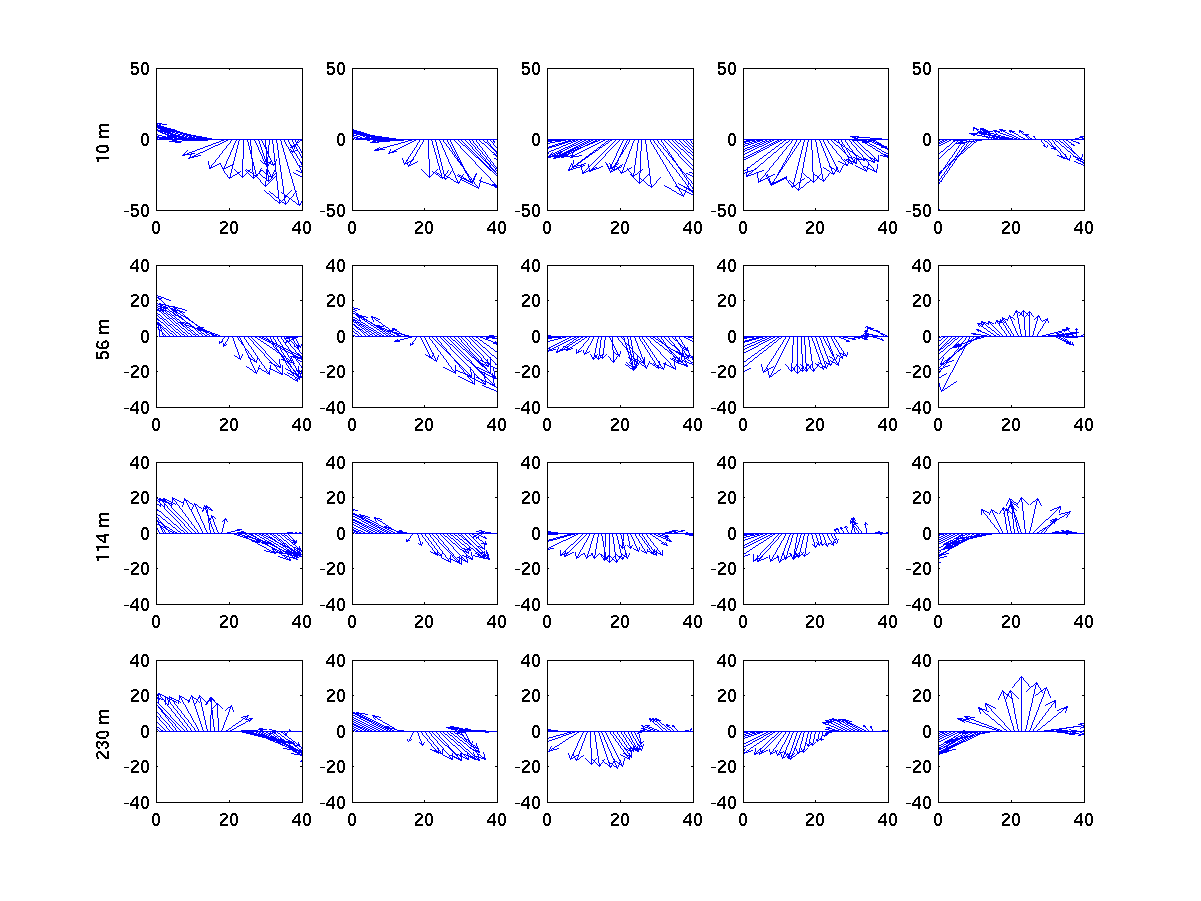
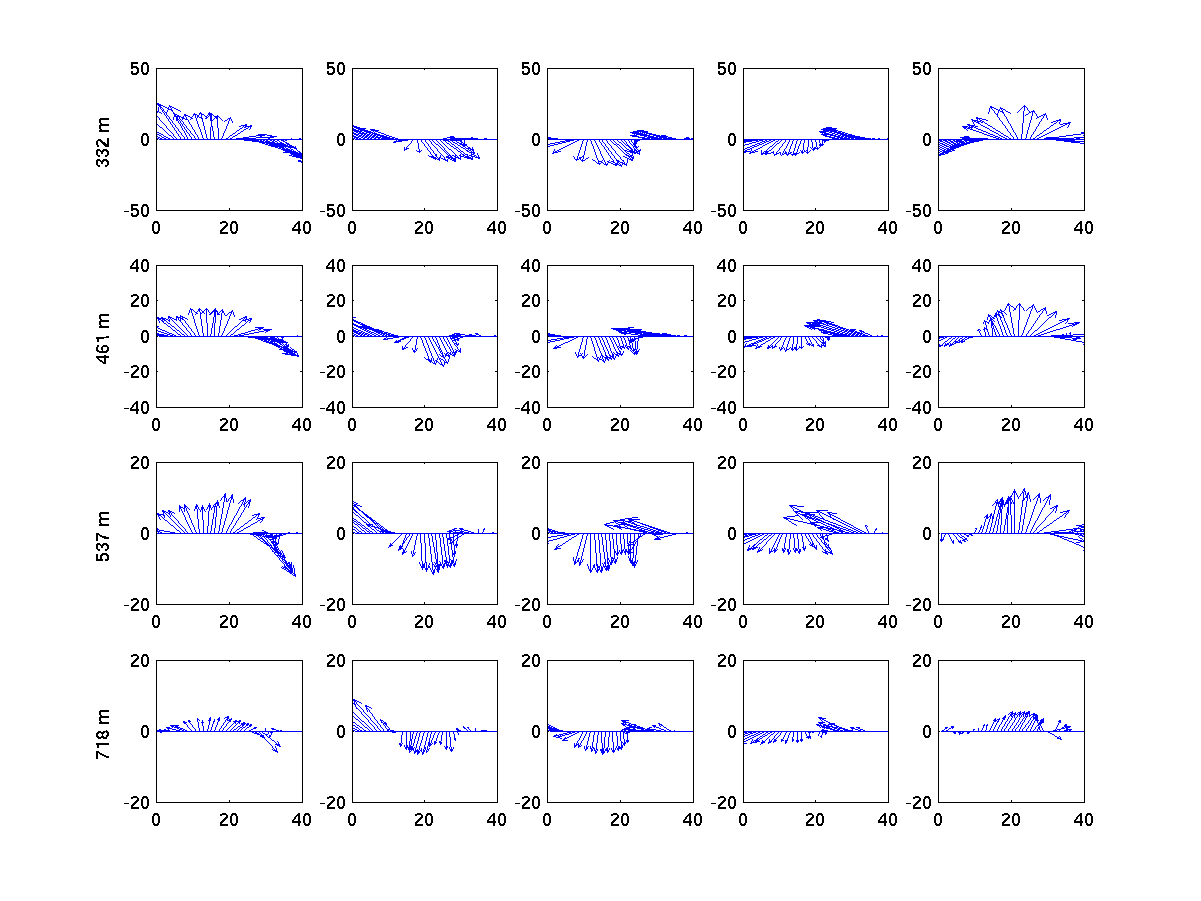
Velocity vector plot at different layers during a particular upwelling event (line across Monterey Canyon)
Shallow water (every 5 day from left to right)
Deep water (every 5 day from left to right)
Contour of vertical velocity
Upwelling event. Mean vertical velocity (the first 15 days averaged). Max. contour is 0.01cm/s (red). Min. contour is -0.01cm/s. The contour is every 1.e-3cm/s.

Upwelling relaxiation. Mean vertical velocity (later 10 days averaged). Max. contour is 0.01cm/s (red). Min. contour is -0.01cm/s. The contour is every 1.e-3cm/s.
