|
ˇ@ ˇ@ ˇ@ ˇ@ ˇ@ ˇ@ ˇ@ ˇ@ ˇ@ ˇ@
Sea Level Variations in the Regional Seas Around Taiwan
Tseng, Y. H., Breaker, L. C., and Emmy T.-Y. Chang (2009),'Sea level variations in the regional seas around Taiwan', Journal of Oceanography (in press). (SCI)Abstract | |||||||||||||||||||||||||||||||||||||||||||||||||||||||||||||||||||||||||||||||||||||||||||||||||||||||||||
Patterns and trends of sea level rise in the regional seas around Taiwan are investigated through the analyses of long-term tide-gauge and satellite altimetry data. The 50 year-long time series reveal decadal and interannual variations and spatially-inhomogeneous patterns of generally rising sea level. The East Asia tide-gauge stations around Taiwan show an average trend of +2.4 mm/yr from 1961-2003 which is larger than the reported global rate of +1.8 mm/yr for the same period. These stations also show significantly larger sea level rise rates (+5.7 mm/yr) than global values (+3.1 mm/yr) during the period from 1993-2003. Consistent with the coastal tide-gauge records, satellite altimetry data show similar increasing rates (+5.3 mm/yr) around Taiwan during the same period. Further comparisons with temperature anomalies in the upper ocean suggest that thermal expansion and heat advection in the upper layer contribute significantly to the long term sea level variations in this area with correlations > 0.9 for observations after 1992. The thermosteric sea-level variations may explain the interannual and decadal variations of the observed sea level rises around Taiwan. Our analysis also indicates that the altimetry data is only a part of a long-term and larger-scale signal. Finally, we find that a non-linear smoother, namely LOESS, is more suitable for extracting long-term trends in sea level than the traditional linear regression approach. | |||||||||||||||||||||||||||||||||||||||||||||||||||||||||||||||||||||||||||||||||||||||||||||||||||||||||||
1. Introduction | |||||||||||||||||||||||||||||||||||||||||||||||||||||||||||||||||||||||||||||||||||||||||||||||||||||||||||
Estimates of twentieth century Sea Level Rise (SLR) are primarily based on coastal tide gauges, which measure the sea surface height relative to coastal benchmarks and often provide long and unique time series. In general, global SLR results from two mechanisms: (1) steric effects: volume change due to seawater density change in response to temperature (thermosteric) and salinity (halosteric) variations; and (2) eustatic effects: mass change due to exchange of water with the atmosphere and continents, such as from glaciers and ice sheets, through precipitation, evaporation, river runoff, and ice melting. However, neither of these processes is currently well understood. Although coastal tide gauges provide the longest records for estimating SLR, these measurements may include other signals such as local subsidence, tectonic motion, and secular trends in vertical movement of the earth's crust and sea surface, e.g., Glacial Isostatic Adjustment (GIA). The GIA is due to the transfer of mass from the ice sheets to the oceans, thus alleviating the loading of the earth, and small spatial-scale tectonic motions (Intergovernmental Panel on Climate Change, IPCC, 2007). It can be roughly corrected using geophysical models (e.g., Tushingham and Peltier, 1991), while the local tectonic and subsidence motions are not easily detected and estimated. Douglas (1997) estimated a globally averaged SLR rate of +1.8 mm/yr using 24 long tide-gauge records after applying GIA corrections. Miller and Douglas (2004) further showed that twentieth century SLR was +1.5~2.0 mm/yr, which includes both volume (steric) and mass (eustatic) changes. This is approximately 2~3 times higher than the rates (+0.5 mm/yr) due to volume changes derived from temperature and salinity data only. Satellite-based estimates suggest that SLR has increased at an even faster rate of +2.8 ˇÓ 0.4 mm/yr since the 1990s (IPCC, 2007). Furthermore, some studies suggest that regional differences in SLR may contribute to large spatial variations in the rate of global SLR (e.g., Church et al., 2004). Larger SLR has been identified in the western tropical Pacific, eastern Indian, and Southern oceans during the last decade (Cazenave et al., 2002; Li et al., 2002). These studies showed the importance of regional SLR and understanding its causes. There are few sea level studies of the regional seas around Taiwan, and none has yet focused on the potential impacts of SLR to Taiwan. Chen (1991) reported SLR at the Changjiang river mouth since the early 1920s. Wang (1998) further estimated the rate of SLR of +2~3 mm/yr along the coast of China during the last century. Overpumping of groundwater and overloading by construction on the delta plain and lowland coast have had serious effects: the average rate of relative SLR is +24.5~50 mm/yr in Tianjing (north China) and +6.5~11.0 mm/yr in the Shanghai (SH) area of the Changjiang River (see locations of cities in Figure 1).
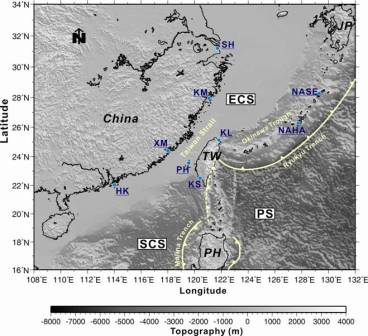 Figure 1: The regional seas around Taiwan and the tide-gauge stations used in this study. Taiwan is surrounded by South China Sea (SCS), Philippine Sea (PS), East China Sea (ECS) and Taiwan Strait. Taiwan Strait is a 200-km-wide shallow passage between Taiwan and China. The tectonic plates are also shown. Abbreviated terms are as follows: JP: Japan, here is the Kyushu island; PH: Philippine, here is the northern Luzon; TW: Taiwan. A major fault line constitutes a convergent boundary east Taiwan (both the yellow dashed lines and solid lines). The information about tide gauge stations is detailed in Table 1.
Recently, Li et al. (2002) used TOPEX/Poseidon (T/P) satellite altimetry data to study the general trend in sea level variation in the South China Sea (SCS) between 1993 and 2000. They found a rise rate of ~ +10 mm/yr with the highest rate of +27 mm/yr near the west of Luzon and generally lower rates over the shallow continental shelves. They attributed the rapid rise in sea level to the rapid warming of the upper layer in the SCS. Cheng and Qi (2007) further analyzed longer satellite altimetry data series (October, 1992~January 2006) in the SCS. They found a rise rate of +11.3 mm/yr during 1993~2000 and, subsequently, a descending rate of ˇV11.8 mm/yr during 2001~2005. The asymmetric distribution of sea level variations over the SCS suggests pronounced variations in this area and the influence of thermal advection. Levitus et al. (2000) showed that the world's oceans have been warming over the last 50 years, with substantial changes in heat content occurring in the upper 300 m to 1000 m in each ocean. Substantial changes in North Atlantic heat content also occur at depths greater than 1000 m. Levitus et al. (2005) further estimated that the global oceanic heat content (OHC) increased by approximately 14.5 ´ 1022 J during 1955~1998. The global mean temperature also increased by 0.037 ˘XC for the whole ocean (0ˇV3000 m) and 0.171 ˘XC for the upper layer (0ˇV300 m). Thermal expansion associated with this warming of the ocean should be associated with a corresponding SLR. Cabanes et al. (2001) reported that the global mean SLR over 1993~2000 reached +3.2 ˇÓ 0.2 mm/yr, close to the estimated 3.1 ˇÓ 0.4 mm/yr based on thermosteric SLR integrated down to 500 m. They also showed that the thermosteric SLR was +0.5 ˇÓ 0.05mm/yr during 1955~1996. Using the salinity data for 1957~1994, Antonov et al. (2002) suggested that the input of fresh water to the oceans could explain the remaining SLR. A decrease in global mean salinity during 1957~1994 and this equivalent increase in fresh water could cause global sea level to increase at a rate of +1.3 ˇÓ 0.5 mm/yr if the added water came from sources other than floating sea ice. Also, spatially-inhomogeneous patterns exist based on their data (Antonov et al., 2002). Taiwan is an isolated island located at the western edge of the Pacific, at the point where the East China Sea (ECS), the Philippine Sea (PS), and the SCS join. An active tectonic oblique convergence exists around Taiwan so that the island is considered to have been tectonically active for the past two million years (Ho, 1986). The surrounding bathymetry is complicated (Figure 1). West of the Taiwan island is the Taiwan Strait, a 200-km-wide shallow passage (less than 100 m in general) between Taiwan and mainland China. The Taiwan Strait is part of the continental margin sea off eastern China. It forms a topographic barrier inhibiting the intermediate- and deep-water circulation. East of Taiwan, the bathymetry drops rapidly down to 4000 m from the coastline. Such steep relief is truncated by the Ryukyu Trench and the Okinawa Trough to the north, which correspond to the northward subduction of the Philippine Sea basin beneath the southeast Chinese continental margin (Figure 1). South of the island of Taiwan is the Luzon-Philippine Archipelago, which is the product of the SCS subduction eastward beneath the Philippine Sea basin. A recent study shows the seamount topography along the northern Luzon-Philippine Archipelago that constrains the Kuroshio to remain primarily in the Pacific Ocean and thus does not intrude far into the SCS (Metzger and Hurlburt, 2001). The main objective of this study is to reconstruct the long-term trends of sea level variation in the regional seas around Taiwan and investigate the possible causes of regional SLR. The critical questions we try to answer are: (1) What are the rates of SLR and their long-term variation in the regional seas near Taiwan? (2) How do these rates of SLR compare with those at other locations around the world? (3) What are the possible causes of the SLR in this area? To our knowledge, long-term sea level variations in the regional seas around Taiwan have not been examined and discussed in the literature except for the SCS. Also, the physical processes affecting sea level variations are not well understood. In this study, more than 50 years of tide-gauge data are used to investigate the long-term variations in sea level in the vicinity of Taiwan. Fifteen years of recent satellite altimetry data are also used for comparison and validation. This paper is organized as follows. In Section 2, the data sources and methods are introduced briefly. Section 3 presents the long-term tide-gauge and satellite altimetry results. Section 4 discusses some possible mechanisms responsible for the SLR. Finally, the conclusions are given in Section 5. | |||||||||||||||||||||||||||||||||||||||||||||||||||||||||||||||||||||||||||||||||||||||||||||||||||||||||||
2. Data sources and methods | |||||||||||||||||||||||||||||||||||||||||||||||||||||||||||||||||||||||||||||||||||||||||||||||||||||||||||
The data used for our analyses consist of more than 50 years' tide-gauge data (1947~2007 for the longest series) and 15 years of altimetry data. Additional subsurface time series temperature data (Ishii et al., 2006) are also used for comparison. Both tide-gauge and altimetry data are described in this section. We have not attempted to apply corrections for GIA or for the inverted barometer effect due to sea level pressure (SLP) in this study. To our knowledge, GIA corrections have yet to be calculated for the study area due to its low latitude (around 23.5˘XN). Also, the expected time scales associated with GIA adjustments are far longer than the time scales of variability in sea level that we consider, and the magnitudes of these corrections are often far smaller than the magnitudes of the sea level variability that we have observed. We have not applied corrections for SLP because, in many cases, observations of SLP at the tide-gauge locations do not exist, or do not exist for the full duration of the tide-gauge records. According to Chelton and Enfield (1986), efforts to separate the local inverted barometer response from other sources of sea level variability have largely been unsuccessful. Finally, it is doubtful that such a correction, if it were applied, would significantly affect any of our conclusions because the magnitudes of variability encountered were relatively large, making it easier to identify the most of the likely sources of variability. 2.1 The tide-gauge dataset
All other monthly observations of mean sea level used here have been obtained from the PSMSL (Woodworth and Player, 2003), which covers 287 tide-gauge stations around the world that are part of the Global Sea Level Observing System (GLOSS) monitoring oceanographic sea level and climate change. Note that both Kaohsiung and Keelung are also available from the PSMSL database but with a few incomplete records. Therefore, we have used the complete records from the CWB database in these areas. The sea level data used in this study are monthly mean values. Note that the ˇ§Revised Local Referenceˇ¨ (RLR) data are used here, which are supported by documentation relating measured sea level at each station to a constant local datum over the complete record. Since our study emphasizes the long-term trend of SLR in the vicinity of Taiwan, the low frequency tidal components such as the nodal tide, which has a period of 18.61 years, may affect the record. However, early studies indicated that the amplitude of nodal tide is latitude dependent and has its maxima near the equator and the poles (Lisitzin, 1974). The amplitude is almost negligible near 30ˇV40˘XN. These features are also typical of the other long-period tidal constituents. Indeed, the comparison with the removal of harmonic nodal mode shows that the influence of long-term nodal tide on our records is minimal near this latitude (not shown here). The longest record we employ (Kaohsiung) begins in May 1947 and ends in December 2007, spanning a period of 60 years. Less than 0.5% of the data are missing from each record and so we have used interpolation to complete the time series in each case. It is well known that the island of Taiwan is tectonically active and that there is a major fault line that constitutes a convergent boundary east of Taiwan (presented by both yellow dashed lines and solid lines on Figure 1). Therefore, we do not consider the tide-gauge stations along the east coast, where greater vertical motion is expected. The measurement sites chosen for this study are located on the same tectonic plate and any vertical displacement due to the plate motion assumes to be small. Tectonic influences will be discussed further in a separate paper. 2.2 Satellite altimetry
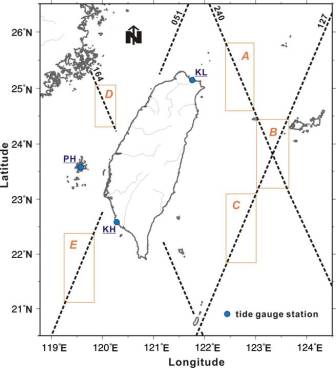 Figure 2: The altimetry tracks used in this study represent in black dash-lines; their track numbers are indicated. The adopted segments for determined SRL are zoned by red rectangles, which are selected around Taiwan with five regions (A-E). | |||||||||||||||||||||||||||||||||||||||||||||||||||||||||||||||||||||||||||||||||||||||||||||||||||||||||||
3. Results | |||||||||||||||||||||||||||||||||||||||||||||||||||||||||||||||||||||||||||||||||||||||||||||||||||||||||||
3.1 Estimating long-term (decadal) trends from the tide-gauge records
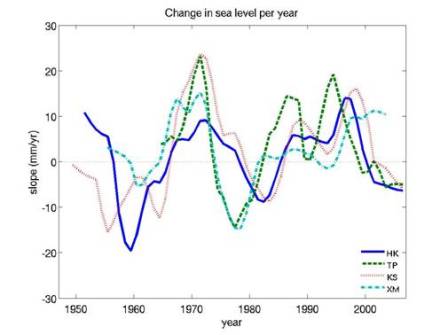
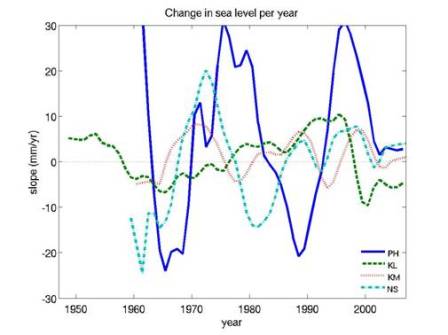
    Figure 3(b) shows the mean sea level variations at Xiamen and Penghu. Both tide gauges show similar peaks during the 1970s. The sudden decrease in slope around 1980 is striking. To verify this tendency, and to compare the actual rates of change in sea level together, we have calculated and compared the yearly forward first differences, which represent the yearly slopes (Figure 5). The average of all slopes during a particular period represents the long-term mean slope (linear trend) for that period. We find that this approach is better and easier to apply than fitting a straight line to the entire record because a straight linear regression completely ignores the possibility that the long-term slope may be non-linear, as shown here. Figure 4 shows the remaining observations north of Taiwan. All stations exhibit similar trends except Keelung. The large increase in sea level during the late 1970s is much weaker and limited at Keelung. An extraordinary rise at Keelung is consistent with the timing of the last reinstallation of station in the early 90s (confirmed by the CWB documents). The artificial effect resulting from the station structure cannot be excluded in this case for the last decadal records in Keelung. Nevertheless, the 18-month moving mean for Keelung detects weaker but still increasing trends for the same period, which are generally consistent with those detected by the other stations. Figure 5 clearly shows the rates of change for each year. The rates of increase drop rapidly after 1980 and even become negative, upon occasion, by the late 1990s. We note that during the period between about 1960 and 2000, although the rates of change vary, there is some degree of constancy. In general, these tide-gauge data show similar trends and decadal variations with different maxima occurring locally with phase differences (e.g., late 1950s~early 1960s: decreasing; 1970s: increasing; 1980s: increasing weakly; late 1990s: increasing), but yet suggest that regional sea level is varying in a coherent manner at low frequencies. These characteristics are summarized below:
3.2 General SLR features from the tidal-gauge and altimetry data over the last 15 years
  Figure 6: The altimetry derived rates of sea level variation during 1993-2007 in the regional seas around Taiwan at different locations (See Figure 2). The straight dash-dotted lines are the linear trends for the whole observation period based on robust linear regression while the solid curves are the non-linear variations estimated by the LOESS analysis. Eighteen months moving mean filters (shown as dash lines) are also applied. The variation of temperature anomaly in the Pacific is also shown here (top panel) for comparison (black solid line, Palmer et al., 2007).
All observations show SLR of at least +4~5 mm/yr except at location E (the linear regression trend is only +0.92 mm/yr), where some satellite observational uncertainties may exist due to the shallowness of the Taiwan Strait (the maximum depth is 60ˇV70 m). Panels B and C, both located east of Taiwan, show quite similar variations (trends and phases, correlation r = 0.95). The sea level variations at E are close to the northeast corner of the SCS and so they should be associated with the regional response in the SCS. The spatial inhomogeneity of sea level trends around Taiwan is not well understood but may be linked to the regional ocean dynamic and thermodynamic processes. Previous studies also suggest that the sea surface temperature anomaly (SSTA) in the SCS is correlated with the eastern Pacific SSTA at a half-year lag (Ose et al., 1997; Xie et al., 2003). Large rates of sea level variation tend to occur east of Taiwan (e.g., in Zones B and C) with a relative maximum SLR around early 1998 (some delayed variations are also observed at other stations), which may be associated with the 1997~1998 El Niño. The relative maximum in the late 1990s is consistent with the tide-gauge data in Figures 3 and 4, indicating the extensive nature of the SLR signals. This appears to result from the long-term variations in the upper OHC down to a depth of a few hundred meters. The variation in the temperature anomaly above the 14 ˘XC isotherm in the Pacific Ocean (Palmer et al., 2007) is also presented in Figure 6(a) based on an 18-month moving mean. The correlation, r, with location A is as high as 0.91, with a one-year delay (> 0.79 if no phase shift is considered). For all other stations r is also greater than 0.86. This analysis provides a more consistent view of the underlying warming and its connection with the SLR near Taiwan. When the OHC increases, sea levels at locations B and C rise through thermal expansion as a result of advection from the warm Kuroshio. More discussion about the OHC is presented in Section 4. In order to further investigate sea level variations in the most recent 15 years and to verify the coastal tide-gauge data, the altimetry-derived SLRs (location E) are also compared with the sea level variations at the nearest coastal tide gauge (Kaohsiung, KS) for the same time period in Figure 7. The altimetry-derived sea level anomalies are generally coincident with the tide-gauge data, including the minimum around 1996 and maximum around 2000. Based on the LOESS, the estimated SLR values from 1993 to 2007 according to the tide-gauge and altimetry (E) are +3.6 mm/yr and +3.1 mm/yr, respectively. The difference is small. However, a large difference is found by using linear regression analysis: the trends are +7.54 mm/yr and +4.46 mm/yr, respectively. Our results suggest that linear trends may not always be representative for regional sea level variations. The LOESS analysis is better for estimating non-linear trends than traditional linear regression because it is based on local regression rather than regression applied to the entire record (Breaker, 2007). Regardless of the analysis methods, the tide-gauge determined trend at Kaohsiung is always larger than that estimated from altimetry. Land subsidence around southwestern Taiwan could be a possible contributing factor. Unfortunately, the actual magnitude of this effect is unclear. 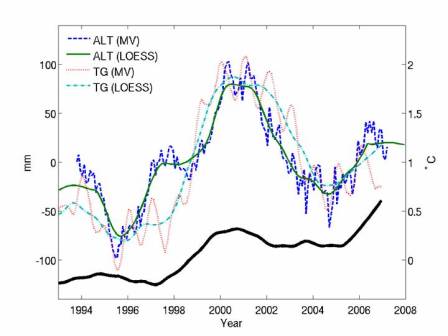 Figure 7: The comparison between the altimetry-derived (location E) and tidal gauge (KS) observed sea level variations. Both eighteen months moving-averaged (MV) time-series and non-linear LOESS analysis results are shown. The time-series, depth integrated (down to 300 m) temperature anomaly in the northeast SCS is also shown here as a thick solid line (Ishii et al., 2006). After 2001, both types of observations show a pronounced fall and the trend of decreasing sea level continues for the next four years, followed by increasing sea level after 2005 (Figure 7). These variations in sea level are an important feature in the SCS (e.g., Cheng and Qi, 2007). We also find that the variations in the tide-gauge determined SLR agree well with the variations in the temperature anomalies in the SCS; see the thick solid line in Figure 7 for the long-term depth integrated (down to 300 m) temperature anomaly in the northeastern SCS (Ishii et al., 2006). The temperature anomalies and the sea level variations from the two sources are similar except for slight differences during the 1997~1998 El Niño. The altimetry-derived sea levels show a larger increase while both tide-gauge data and the observed temperature anomaly exhibit similar trends. The agreement between the tide-gauge determined SLR and the temperature anomaly supports the idea that regional ocean warming plays an important role in the observed sea level variations. The correlation is close to 0.9 while it is only 0.81 between the altimetry-derived SLR and the temperature anomaly. Our results suggest that over the last 15 years sea levels around Taiwan have risen and appear to be associated with thermal expansion. The recent large variations in the regional seas around Taiwan could be transient, as suggested by the increasing rates of SLR during the late 1990s followed by decreases in the rate of SLR. However, comparing the long term variations in the tide-gauge data with the results of the 15-year period of satellite altimetry may not allow us to infer long-term climate changes, due to the apparent lack of decadal influences in the trends. 3.3 Regional variations and the relation between the regional seas around Taiwan and the global ocean
Based on the coastal tide-gauge data from locations near Taiwan, Table 2 also shows mean rates of rise of +3.5 mm/yr from 1955~2003 and +2.4 mm/yr from 1961~2003, respectively. The difference indicates largely increasing sea level during the 1950s and substantial interannual variability. These values are also relatively large compared with the global mean value of +1.8 mm/yr derived from the records of 25 tide-gauge stations around the world for the same period. Similar to the recent 15-year trend, this relatively high value could be due to primarily regional influences. Note that the recent increasing rate of SLR (1993~2003) is also much higher than (more than double) the mean rate of the last 50 years. The ratio is consistent with the other global estimates (IPCC, 2007), except that the rates we have observed are higher. In the next section, we will further discuss the possible causes of the regional SLR around Taiwan. ˇ@ | |||||||||||||||||||||||||||||||||||||||||||||||||||||||||||||||||||||||||||||||||||||||||||||||||||||||||||
4. Possible mechanisms for the long term trends | |||||||||||||||||||||||||||||||||||||||||||||||||||||||||||||||||||||||||||||||||||||||||||||||||||||||||||
|
4.1 Upper ocean warming effect
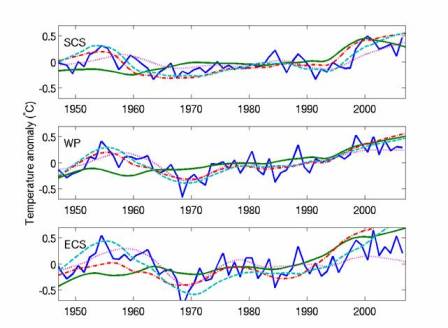
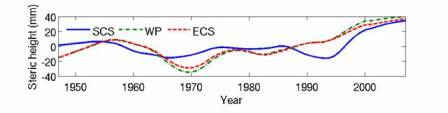
Antonov et al. (2005) and Ishii et al. (2006) estimated an approximate value of +1.2 ˇÓ 0.5 mm/yr for the global SLR (1993~2003) that is due to thermal expansion in the upper 700 m. This is also subject to significant regional redistributions of heat and spatially inhomogeneous patterns. Thus, more SLR may result from eustatic effects at high latitudes while ocean warming may dominate at lower latitudes. Ishii et al. (2006) showed that the thermosteric component is dominant in the sea level change around Japan. They also found that tide-gauge agreement is usually better in areas where the thermosteric effects are regarded as a dominant contributor to steric SLR. Figure 8 (a) shows a LOESS analysis of the Ishii subsurface temperature anomaly data since 1946 at different depths (Ishii et al., 2006). The 0ˇV300 m depth averaged temperature anomaly is also shown as blue solid lines (without smoothing). We divided the 1˘X ´ 1˘X resolution temperature data into three different regions: the SCS, WP and ECS. These represent the regional seas to the south, east, and north of Taiwan. Similarly to the other regions in the North Pacific, there is a consistent warming signal in Figure 8 (a). The corresponding steric sea level variation for each region is also presented in Figure 8 (b), which shows clear thermal influences. Analysis of individual regions shows that the upper layer temperature has increased by more than 1 ˘XC over the last 60 years. The Pacific has been warming since the 1950s and two major peaks, in the 1950s and the late 1990s, are observed. A minor warming peak in the late 1970s has also been observed in WP and ECS, similar to those shown by the observed tide-gauge data near Taiwan (e.g., there is positive but decreasing forward differences around the late 1950s and large positive forward differences around the 1970s and 1990s in Figure 5). Most of the tide-gauge data correlates well with the steric height variation in the nearby regions. For example, the correlation between the observed sea level variation at station NH and the estimated steric height variation for ECS in Figure 8(b) can be as high as 0.92. The lowest correlation is observed in station NS (0.48). Note that the high sea levels usually correspond to high temperature anomalies at 100ˇV300 m depths (100 m depth shown as dashed lines and 200 m depth shown as dots), which are particularly clear for the observed warming during the 1950s while the surface temperature is cool. This suggests that, consistent with the nearby regions (e.g., Kang et al., 2005), thermal expansion could be a major contributor to the observed SLR around Taiwan, at least during the last 50~60 years.
Comparing the regional warming with the global ocean, Antonov et al. (2005) and Ishii et al. (2006) estimated an average thermosteric trend of 0.33 mm/yr and 0.36 mm/yr, respectively, during the period 1955~2003. The rate of thermosteric SLR varies significantly with time. Both the Levitus and Ishii data sets show that a significant rise occurred from the late 1960s to the late 1970s with a small decrease afterwards. Another large rise began in the 1990s but decreased after 2003. These patterns indicate larger accelerations in the SLR during the 1950s, late 1970s, and late 1990s. Interestingly, they are quite consistent with the regional SLR trends shown in Table 2 and Figures 5 and 8. This evidence suggests that SLR in the regional seas around Taiwan tends to be dominated by decadal signals in the regional OHC while the eustatic influence is limited. This pattern may be associated with sea level variations in the entire Pacific basin. Since the Pacific is strongly influenced by interannual variability associated with ENSO (an oceanˇVatmosphere coupled mode in the climate system), the ENSO-related ocean variability may account for the largest fraction of variance in spatial patterns of thermosteric sea level which has caused the largest increases in SLR in the last few decades (IPCC, 2007; Sun and Yu, 2009). Similarly, the observed SLR trends (or thermosteric sea levels) could be partially associated with the Pacific Decadal Oscillation (PDO) which may be related to the basin-wide regime shift that occurred in 1976~1977. In either case, thermosteric effects most likely explain the decadal variations we have observed in the regional tide-gauge data. 4.2 Other possible factors
Ocean circulation changes may also cause sea level variations. To the best of our knowledge, the long-term regional ocean circulation has not changed significantly in terms of the overall transport. Finally, tectonic movements or local subsidence (e.g., due to groundwater withdrawal and terrestrial storage) could introduce a large amount of uncertainty. Some stations may be subsiding, thus giving even higher apparent SLR rates. Other relevant results show that local subsidence is occurring along many coastal regions in Asia. This could be due to the draining of underground aquifers in coastal regions to supply fresh water. However, the observations acquired during different periods show that long-term relative sea level variations should not be significantly affected by local effects. These factors may only contribute to the observed inhomogeneous patterns between the stations but do not affect the similarity of the long-term trends dominated by regional sea level evolution. | |||||||||||||||||||||||||||||||||||||||||||||||||||||||||||||||||||||||||||||||||||||||||||||||||||||||||||
5. Summary | |||||||||||||||||||||||||||||||||||||||||||||||||||||||||||||||||||||||||||||||||||||||||||||||||||||||||||
|
We present sea level information or trends and variability over a 50-year period for the regional seas around Taiwan. Similar trends and patterns are detected at most stations. For the period 1993~2003, the available tide-gauge records show an average rate of SLR of about +5.7 mm/yr, which is more than twice that observed during 1961~2003 (+2.4 mm/yr). This implies that there have been higher accelerations in SLR in recent decades. The rise rate is quite consistent with previous estimates from nearby areas in the western Pacific and is generally higher than the global mean. Larger spatial and temporal variations are also found in the tide-gauge data. Satellite altimetry is also used to verify the regional sea level variations over the past 15 years. For the period 1993~2003, the altimetry-derived SLR is +5.3 mm/yr. There is good agreement between the altimetry and the tide-gauge data. Further comparisons with regional OHC suggest that thermal expansion and heat advection in the upper layer make a significant contribution to long-term sea level variations in this area (the correlation is higher than 0.9). Specifically, thermosteric sea level variations appear to dominate the observed SLR around Taiwan. The interannual and decadal oscillations in sea level could result from coupled oceanˇVatmospheric climate perturbations such as ENSO and/or the PDO in the North Pacific. Based on the tide-gauge data, the long-term regional patterns in sea level show clear decadal scale variations. Since the altimetry records are relatively short, the long-term trend of SLR can only be estimated from the tide-gauge records. Our results suggest that the time series signal from the altimetry is only part of a longer-term and larger-scale signal. This implies that extrapolating SLR to future scenarios using only satellite altimetry (after 1993) requires caution. Further study of the ocean heat budget could provide additional information on the cause of the decadal oscillation in the OHC, which is presently not well understood. Further studies based on general ocean circulation models are required. | |||||||||||||||||||||||||||||||||||||||||||||||||||||||||||||||||||||||||||||||||||||||||||||||||||||||||||