| |
Important Date
Hotel reservation special rate deadline is 30 March.
|
| |
|
|
|
|

|
|
|
|
|
|
Abstract Submission
The Workshop program will feature both oral and poster
presentations. All presenters (oral and poster) must submit an abstract
electronically to Yu-Heng Tseng(yhtseng@as.ntu.edu.tw).
Notice indicating acceptance as either oral or poster presentation of
contributed papers will be informed by e-mail in early March 2008.
Recommended format of the abstract is as follows:
-
Author(s)/Organization with mailing and email addresses, telephone and fax
numbers
-
Title of presentation
-
Extended Abstract (two-page limit)
-
Presentation (Oral or Poster)
Workshop publication:
Extended abstracts of all oral and poster presentations will be published in
the workshop proceedings before the meeting. The selected papers will be
considered to be published in a SCI journal: Terrestrial, Atmospheric and
Oceanic Sciences (http://tao.cgu.org.tw).
Deadline for abstract submissions is 31 January, 2008.
Registration will remain open until 17 April, 2008.
Oral Presentation
-
Emil V. Stanev
Coastal Observation and a Forecasting System for the German Bight
Emil V. Stanev and Franciscus Colijn, GKSS, Institute of Coastal Research,
Geesthacht, Germany
Coastal and shelf seas mediate important heat, water and matter fluxes, which
have significant impacts on regional water quality as well as global climate In
turn, they experience drastic transformations in response to anthropogenic
activities and global change. Monitoring and forecasting these changes can only
be addressed by a combination of state-of-the-art observations and modelling
activities, providing objective measures of uncertainty in the state estimates
and forecasts. This is needed for applications in marine ecology and fisheries,
abatement of pollution and oil spills, different naval operations and shipping.
Improving the performance of observing and forecasting systems requires a clear
identification of relevant parameters and representation of multiple physical
and biogeochemical processes in numerical models.
In recent years, operational oceanography showed a rapid development at global
and regional scales, however downscaling to the coastal sea is still a matter
of proper scientific investigation before it becomes part of the operational
suite. One important field of development which we demonstrate in this paper is
the extensive exploitation of presently available data (with high quality and
capacity of contained information) such as ADCP (incl. back scatter signals
resolving sediment concentration and transport), FerryBox data, such as S, T,
and chlorophill, fine resolution (about 200 m) satellite images etc. Another
fundamental research direction isthe development of high resolution, accurate
and verifiable numerical ocean models with clear predictive capabilities. With
the exception of some site-specific studies, such capabilities are still
limited.
We review here theoretical concepts, novel observations and
results of numerical simulations for the German Bight and the East Frisian
Wadden Sea. Numerical simulations use nested 3-D numerical model coupled with a
suspended matter transport model. It is demonstrated that combining theory and
observations facilitates understanding of some basic processes, such as
Stokes-drift induced vertical circulation, effects of breaking wind waves, and
the interplay between turbulence and transport. The good agreement between
observations and simulations provides convincing evidence that the model
simulates basic hydrodynamics and sediment transport. This motivates further
use of developed tools as a building block for the German Bight observational
and forecasting system. This system represents a unique device with a new
quality of marine observations as it bundles sensors and models for the
physics, biogeochemistry and ecology of coastal seas. It emerges as a spatially
distributed observatory providing the necessary coverage to characterize highly
dynamic, interconnected and heterogeneous environments. Data processing,
analysis and assimilation into models are an integral part of the system. The
operation of this system will be maintained over at least a decade.
-
Kyung-II Chang
Development and Validation of Data Assimilative East Sea Regional Ocean Model
Kyung-Il Chang1, Young Ho Kim2, Gyun-Do Park 1, Young-Gyu Kim3
-
Research Institute of Oceanography/School of Earth and Environmental Sciences,
Seoul National University, Seoul 151-742, Korea
-
Coastal Engineering Research Department, Korea Ocean Research and Development
Institute, Ansan P.O. Box 29, Seoul 425-600, Korea
-
Agency for Defense Development, P.O. Box 18, Chinhae 645-600, Korea
-
Observations of the East Sea circulation
The East/Japan Sea (the East Sea hereafter) is a semi-enclosed deep marginal
sea in the northwestern Pacific. The total area and average depth of the East
Sea are approximately 106 km2 and 1,700 m, respectively. It consists of three
basins deeper than 2,000 m: the Japan Basin in the northern half which is
almost 4,000 m deep, and the Ulleung Basin (UB) in the southwest and the Yamato
Basin in the southeast. The East Sea is often called a miniature ocean in that
it has many oceanic processes despite of its small basin size. The East Sea is
divided into warm and cold water regions with the subpolar front in between
them at around 38˘XN. The southern warm water region is fed by the Tsushima
Current flowing into it through theshallow (<200 m) Korea Strait between
Korea and Japan. The warm water flows out of the sea to the North Pacific and
the Okhotsk Sea through the shallow(<100 m) straits, the Tsugaru Strait and
Soya Strait, respectively. The Tsushima Current originating from the Kuroshio
splits into two or three branches downstream of the Korea Strait: one flowing
northeastward along the western coast of Japan called the Nearshore Branch, and
another northward along the east coast of Korea the East Korean Warm Current
(EKWC) (Fig. 1). The EKWC constitutes the western boundary current south of the
subpolar front. Another branch, called the Offshore Branch, is also fed by the
Tsushima Current flowing through the western channel of the Korea Strait, and
flows to the northeast offshore of the Nearshore Branch trapped along the
continental shelf break and slope off the coast of Japan (Hase et al., 1999).
Basin and sub-basin scale cyclonic upper circulation prevails in the Japan
Basin north of the subpolar front. Strong coastal currents occur along the
Siberian and North Korean coast, called the Liman Cold Current and the North
Korean Cold Current (NKCC), respectively. The NKCC flowing southward along the
east coast of Korea encounters the EKWC at around 37˘X~38˘XN, and then two
western boundary currents separate from the coast and meanders to the east.
Part of the NKCC penetrates farther south beneath the EKWC forming a southward
flowing deep western boundary current (Yun et al., 2004). The North Korean Cold
Water carried by the NKCC is often traced by a salinity minimum layer (SML)
(Kim and Kim, 1983). The SML is also found in the Ulleung Basin interior,
called the East Sea Intermediate Water (Kim and Chung, 1984), which is also
thought to be formed in the Japan Basin and subducted below the Tsushima
Current Water south of the subpolar front (Kim et al., 2004). The East Sea
Intermediate Water could also be fed by the North Korean Cold Water due to the
EKWC and UWE (Cho and Kim, 1994; Kim and Yoon, 1999). The submerged NKCC often
reaches the Korea Strait carrying the cold water below the Tsushima Current
called the Korea Strait Bottom Cold Water. Part of the eastward meandering of
the EKWC forms a quasi-permanent anticyclonic eddy called the Ulleung Warm Eddy
(UWE), and the meandering trough of the EKWC often sheds a smaller scale cold
eddy called the Dok Cold Eddy (DCE) (Mitchell et al., 2005b). Both eddies exert
a strong influence in the upper circulation variability in the Ulleung Basin.
Deep water formation occurs in the Japan Basin and spread towards the southern
basins through deep passages. Mean abyssal circulation in each of three deep
basins of the East Sea is primarily cyclonic with relatively strong flows along
the basin periphery and weak flows in the interior regions (Senjyu et al.,
2005). Mean circulation at 500~700 m depth range in the Ulleung Basin revealed
by profiling floats is characterized by a cyclonic circulation along the
periphery of the Ulleung Basin, and it was conjectured that the southward flow
along the east coast of Korea is a continuation of the North Korean Cold
Current (Park et al., 2004). An extensive moored observation was made in the
Ulleung Basin between June 1999 and June 2001, which provide unprecedented
opportunity to study and model the upper and deep circulation with their
temporal variability (Mitchell et al., 2005a). At least five quasi-stable
non-repetitive upper circulation patterns have been identified during the
two-year period. Each pattern persisted 3-5 months with a period of the
transition between successive patterns ranging from a few days to a couple of
months. This data set constitutes a basis for the validation of our data
assimilative numerical model. A comprehensive review of the hydrography and
circulation in the Ulleung Basin can be found in Chang et al. (2004).
-
Development of East Sea Regional Ocean Model (ESROM)
The ESROM is based on the MOM 3 (Modular Ocean Model version 3, Pacanowski and
Griffies, 1999) which is a finite difference model with the horizontal B-grid
and vertical z-coordinate. The MOM 3 adopts the MPI (Message Passing Interface)
parallel processing to reduce computational time, and includes the free surface
momentum equations for the barotropic system (Griffies et al., 2001).
Longitudinal resolution of the ESROM varies from 0.06˘X (about 5 km) near the
western boundary to 0.1˘X (about 10 km) to the east of 130˘XE, and the
latitudinal resolution is fixed to 0.1˘X. The vertical resolution also varies
from 2.64 m at the surface to 445.97 m near the bottom with 42 vertical levels.
The sub-grid scale processes are parameterized using the Laplacian friction
form with Smagorinsky Scheme (Smagorinsky, 1993). For the tracer diffusion on
the isoneutral surface, the RM scheme for the eddy induced advective and
diffusive flux of tracer (Roberts and Marshall, 1998) is employed. The KPP
(K-profile parameterization) boundary layer mixing scheme (Large et al., 1994)
parameterizes the ocean boundary layer depth, vertical diffusivity and
viscosity, and non-local transport in the ESROM. The model was initialized
using hydrographic data from WOA (World Ocean Atlas, 2002), and forced by
monthly mean surface and open boundary conditions. Reanalyzed products of ECMWF
for surface wind stress and heat flux are used as surface boundary conditions.
For the salt flux, the surface salinity in the model is relaxed to the
climatology from the WOA with relaxation time scale of 10 days. The ESROM has
three open boundaries, and a radiation condition with a nudging term for inward
boundary fluxes is applied for the tracers and barotropic currents with no
gradient condition for the surface elevation across the open boundaries
(Marchesiello et al., 2001). To conserve the mass, a correction velocity is
added to the barotropic velocity obtained from the radiation condition. The
barotropic velocity through the Korea Strait is prescribed based on the volume
transport data acquired from the measurement of the submarine cable voltage
(Kim et al, 2004). The same amount of the volume transport is prescribed
through the Tsugaru Strait and Soya Strait with the volume transport through
the Tsugaru Strait given twice the transport through the Soya Strait (Na et
al., 2007). The temperature and salinity of the inflow are relaxed to the WOA
climatology with a 5-day timescale. We have implemented a 3-dimensional
variational data assimilation (3DVAR) scheme to the East Sea Regional Ocean
Model (DA-ESROM). The basic formulation and terminology for the 3DVAR scheme
follow Weaver and Courtier (2001) since their scheme based on correlation
models is numerically efficient and supports the various shapes of correlation
functions, for example, complex geography. The 3DVAR scheme formulated in this
work has a general form so that it can be applied not only to the East Sea but
also to other regions. Satellite-borne sea surface temperature (SST) and sea
surface height anomaly (SSHA) data, and temperature profiles have been
assimilated into the DA-ESROM from 1993 to 2002. The NODC/RSMAS AVHRR Oceans
Pathfinder SST Version 5.0 data have been sub-sampled every 16 km and then
assimilated into the surface level of the DA-ESROM every day. SSHA data are
assimilated into the model following Cooper and Haines (1996). The merged SSHA
of the DT-MSLA (Delayed Time ˇV Merged Sea Level Anomaly) produced by the AVISO
has been assimilated into the DA-ESROM every 7 days. The DT-MSLA provided by
the AVISO is a merged product which combines TOPEX/POSEIDON, Jason-1, ERS-1/2,
ENVISAT, and GFO data. Temperature profiles in the southern region have mainly
been archived from KODC (Korea Oceanographic Data Center) and JODC (Japan
Oceanographic Data Center). In the northern East where temperature profile data
are scarce, data obtained from CREAMS (Circulation Research of the East-Asian
Marginal Seas) Program and Argo floats are used. Since the data quality of the
salinity from the CTD profiles is not fully credible, only temperature data
have been used.
-
Model/data inter-comparison
For the validation of the DA-ESROM, we compare the directly observed daily
evolution of 100-dbar temperature field between June 1999 and June 2001 from
Mitchell et al. (2005a) and model-produced daily 100 m temperature during the
same period. We also analyze model-produced NKCC flowing southward under the
EKWC, which has not been properly simulated in the previous East modeling
studies (Kim and Yoon, 1999; Yoshikawa et al., 1999). The DA-ESROM fairly well
simulates the observed high variability of the UWE and DCE in the UB (Fig. 2).
From October 1999 to Jaunary 2000, the UWE migrated northward and its zonal
size was almost doubled. Simultaneously, the DCE moved westward and collapsed
when it approached the east coast of Korea. The variability of the UWE is
relatively weak from April to July 2000, when it resided around the Ulleungdo
and its size was rarely changed. The DCE, however, experienced a series of its
evolution from its formation, westward propagation, and to the collapse near
the coast of Korea. The DCE often interrupted the northward flow of the EKWC;
as the DCE approached the east coast of Korea, the EKWC separated further south
in January 2000 or even it disappeared along the Korean coast in July 2000.
Fig. 3 shows the spatial distribution of correlation between observed and
model-produced 100 m/100-dbar temperature fields, and a high temporal
correlation over 0.7 is found north of 37˘XN. It is interesting to note that the
spatial correlation is high around Ulleungdo where the RMS error between the
observed and modeled temperature is also high. Low correlation less than 0.3 is
found in the middle of southern UB where the observed data, assimilated into
the DA-ESROM, were scarce. While the spatial correlation between the observed
and modeled temperature fields is high with a spatially-averaged value of 0.79,
it was low in February 2000 and June 2001 when the DA-ESROM could not well
resolve the UWE in terms of its position and size. The DA-ESROM has also
reproduced the southward NKCC beneath the EKWC, which resembles the observed
feature (Fig. 4). Comparing the model-produced vertical sections of
temperature, salinity, and current in May, 2000 with those observed in the same
period (Chang et al., 2002), the depth of the SML in the model is still deeper
by about 50 m and itˇ¦s location appears offshore. The speed of the NKCC in the
model is also weaker than that in the observation. In addition, the northward
surface current seen in the observation east of 130.4˘XE was not reproduced in
the model. These discrepancies may arise from either the poor grid resolution
or unresolved geometric feature. Nevertheless, it is notable that the DA-ESROM
reproduced shallower SML depth and stronger NKCC as compared with other model
results. The volume transport of the NKCC in the model strengthens from spring
to summer and is strongest in summer generally, which is qualitatively
consistent with observational results. Model results indicate that the
southward NKCC along the east coast of Korea turned cyclonically around the
Japanese coast at the southernmost edge of the UB, which is schematically shown
in Fig. 5.
Fig. 1. (a) Schematic surface circulation of the East Sea (Naganuma, 1977). C, cold-water region; W, warm-water region; H, relatively high temperature region. EKWC, NB, LCC, and NKCC denote the East Korean Warm Current, Nearshore Branch, Liman Cold Current, and North Korean Cold Current, respectively. (b) Mean geopotential height anomaly relative to 500 dbar divided by the acceleration of gravity over the 2-yr deployment in the Ulleung Basin. The white diamonds, from left to right, are Ulleungdo, Dokdo, and a seamount that reaches within 500 m of the surface. (Mitchell et al., 2005b).
Fig. 2. Sea surface height and current (left), and temperature and current at 340 m (right) produced by the DA-ESROM on 24 February 1999.
Fig. 3. Spatial distribution of correlation between 100m/100-dbar temperature fields from the DA-ESROM and 2-yr observation.
Fig. 4. Vertical sections of observed temperature, salinity, and current along a zonal section in the Ulleung Basina (upper panel, Chang et al., 2002) and simulated temperature, salinity, and current across the same section (lower panel) in May, 2000.
Fig. 5. Schematic circulation pattern based on DA-ESROM model results
in April, 1999
-
Naoki Hirose
Data assimilation modeling of the Japan/East Sea and its impact on regional
meteorology Naoki HIROSE and Masaru YAMAMOTO (Research Institute for Applied
Mechanics, Kyushu University)
We report our assimilation modeling efforts and related studies in the
Japan/East Sea (JES) area. An eddy-resolving, free-surface ocean circulation
model is driven by daily meteorological forcing of JMA regional forecast at the
surface and monthly measurement data at the horizontal boundary. The top layer
is restored to the remotely-sensed temperature as Manda et al., JAOT (2005).
The SST assimilation reduces the average residual variance from 4.55 to 2.09
K^2 and presents small-scale features even finer than the original
satellite-based data set. An approximate Kalman filter corrects the subsurface
density and velocity conditions based on the difference between the observation
and the model at the sea surface height (Fukumori et al., JGR, 1999). The
sequential updates of the error covariance require more computational overheads
than the steady covariance but significantly reduces high-frequency barotropic
uncertainties in the northern waters. The assimilated results show realistic
upper circulations such as the separation of the East Korean Warm Current or
the quasi-biennial oscillation (Hirose and Ostrovskii, JGR, 2000) in comparison
to in-situ subsurface measurements. The forecast limit strongly depends on the
variable, depth, and location (Hirose et al., J. Oceanogr., 2007). The
forecasted results are found at our web server
(http://oops.riam.kyushu-u.ac.jp) or at a local newspaper. Our study also
demonstrates that the assimilated estimates of the JES improve winter
atmospheric conditions from meso to seasonal scales. The sharp frontal
structure of the assimilated SST strongly modifies the mesoscale features over
the southern JES as simulated by a non-hydrostatic atmospheric model (Yamamoto
and Hirose, GRL, 2007). It is also found that the total amount of the DJF
precipitation is lead by the regional ND SST and is largely controlled by
autumn transport of the Tsushima Warm Current (Hirose and Fukudome, SOLA,
2006). A large amount of meridional heat transport of the Tsushima Warm Current
spreads over the southern JES in autumn, and affects the strength of
evaporation at the surface in winter
-
Joanna Staneva
Understanding Black Sea Dynamics: Overview of recent modelling
J. V. Staneva Institute for Coastal Research, GKSS Research Center, Germany
The importance of the Black Sea extends far beyond its regional role as a
mixing body where Mediterranean water dilutes. This sea provides a marine
environment acting as a small scale laboratory for investigation of processes
that are common to different areas of the world ocean. In particular, the
research on deep ventilation could facilitate understanding similar controlling
processes in the world ocean in the past when the ocean conveyor belt was
shallower. Because the water and salt balances are easily controllable and the
scales are smaller than of the global ocean this basin is a useful test region
in developing models, which can be further applied to larger scales. The major
aim here is to demonstrate that studying outputs from numerical models is an
important complement to the sparse observations and provides an important
scientific guidance, the latter proved by the fact that number of fundamental
results have been first derived from theory and afterwards supported by
observations.
Data from observations and numerical simulations are used with the aim of
understanding and quantifying the pathways of passive tracers penetrating into
the Black Sea intermediate and deep layers. The major data source includes
chlorofluorocarbon (CFC) concentrations measured during the1988 R/V Knorr
cruise, which show consistent decrease with increasing density in the Black Sea
and demonstrate the poor ventilation conditions in the deep basin. We develop a
3-D numerical model based on MOM, and calibrate it in a way to produce
consistent simulations. The forcing includes interannually variable wind, heat
and water flux constructed from COADS and ECMWF atmospheric analysis data and
river runoff data. The analysis of observations and simulated data is focused
on the correlation between thermohaline and tracer fields, dynamic control of
ventilation, and the relative contributions of sources at the sea surface and
the outflow from Bosporus Strait in the formation of intermediate and deep
waters. Part of the study addresses the control by the fresh water balance on
the vertical penetration patterns, including extreme cases, which might have
existed in the ancient Black Sea. The analyses of simulated and observed CFCs
demonstrate that under the stagnant present-day conditions the surface CFC
signals have reached only the upper halocline. Intrusions below 600 m are not
simulated. The pathways of penetration of CFCs are connected with cold water
mass formation sites, Bosporus effluent, as well as with the diapycnal mixing
in the area of Rim Current. Estimates about further sampling strategies
coherent with the specific Black Sea conditions are provided.
We also employ coupling between physical and biogeochemical numerical models
and provides an extensive analysis on the response of the ecosystem in the
Black Sea to nutrient loads and climatic changes. The physical models are a
one-dimensional mixed layered model and a three-dimensional, primitive equation
hydrodynamic model. The Biogeochemical model is based on the European Ecosystem
Model (ERSEM). The model consists of five modules: (1) primary producers, (2)
microbial loop, (3) mesozooplankton, (4) benthic nutrients, and (5) benthic
biology. The ecosystem in ERSEM is subdivided into three functional types:
producers (phytoplankton), decomposers (pelagic and benthic bacteria) and
consumers (zooplankton and zoobenthos).
The impact of meteorological forcing, as well as the impact of vertical
stratification on the functioning of the biological system is addressed. The
evolution of the mixed layer, as well as the response of the biological system
to variability in the physical conditions and to the nutrient discharge from
the Danube River are described in detail. The model results are validated
against data from observations and SeaWiFS satellite data.
The numerical simulations illustrate the basic physical and biological dynamics
of the upper ocean. The results from the simulation of the seasonal cycle of
the lower trophic levels are presented. Important climatological features for
the Black Sea, such as the formation and advection outflow salinity waters
associated with the Danube River plume, the cold intermediate water formation,
the evolution of the seasonal pycnocline are discussed. A hierarchy of model
scenarios has been developed to study the impact, which nutrient reduction has
on the coastal marine system. The model predictions indicate that the
biological system is very sensitive to the changes in nutrient concentrations,
as well as to C:N:P:Si ratios.
| Author address: |
| Institute for Coastal Research
|
| GKSS Research Center, Max-Planck-Strasse 1,
|
| D-21502 Geesthacht, Germany
|
| Phone: +49 (0)441 798 3635; +49 (0)441 9608386
|
| Fax: +49 (0)441 798 3404; E-mail: Joanna.Staneva@gkss.de
|
-
David E. Dietrich
Ocean Model Subgridscale Dissipation Parameters by David E. Dietrich
Many ocean modelers have walked a fine line between using too much dissipation
to allow accurate representation of important currents and not using enough
dissipation to allow robust computation. The DieCAST model has never had to
walk that fine line, because of its robustness with small dissipation. Indeed,
in the absence of data assimilation or spectral nudging, its many
well-validated applications have shown that using much smaller than
conventional dissipation parameters gives best results. Its results generally
get better with decreasing dissipation until it is so small that dissipation
has minor effect on all resolved flow features; that is, the scaled cell
Reynolds number is much greater than unity, as is the effective Reynolds number
of the real ocean on all scales that can be resolved by a basin scale model. It
is not even clear that purely dissipative approaches for subgridscale
turbulence closure are fundamentally correct (e.g., as in Holloway's "Neptune
effect" and in Starr's book "The Physics of Negative Viscosity").
In this light, results from DieCAST model applications -- including to the Gulf
of Mexico, California Current system, Black Sea, Mediterranean Sea, Adriatic
Sea, North Atlantic Ocean and coupled Mediterranean Sea and North Atlantic
Ocean using a six grid framework that resolves the Strait of Gibraltar -- and
my interpretations thereof, will be used to suggest that tuning model
dissipation parameters to satisfy special desired conditions such as the mean
Gulf Stream and Kuroshio Extension path, when the equatorial boundaries are
artificially closed (even when using equatorial sponge layers), may be
disappointingly ineffective, because the real ocean has so little dissipation
of the resolved scales. Although the surface signal dissipation time scales may
APPEAR to be O(100) days or shorter, Bob Haney's California Current studies
using DieCAST suggest that, as a result of isopycnal flattening by baroclinic
eddies initially analyzed theoretically for the atmosphere by Wiin-Nielsen, the
surface eddy energy loss may be dominated by downward energy propagation rather
than by dissipation.
-
Jinyu Sheng
The Dynamic Response of Coastal Waters on the Inner Scotian Shelf to Tropical
Storm Alberto, a Modelling Study using a Nested-Grid Coastal Circulation
Prediction System
Jinyu Sheng and Bo Yang
Department of Oceanography
Dalhousie University, Halifax, Canada, B3H 4J1
Alberto accelerated northeastward to the Canadian Maritime provinces and
deepened into a powerful post-tropical storm on June 15 of 2006 with the
maximum peak wind of about 100 km/h. A nested-grid ocean circulation prediction
system known as NCOPS-LB was used to simulate the three-dimensional (3D)
circulations and hydrographic distributions over coastal waters of the inner
Scotian Shelf. The NCOPS-LB has five sub-models, with the outmost two
sub-models to be a two-dimensional (2D) storm-surge sub-model for the eastern
Canadian seaboard from Labrador Sea to Gulf of Maine with a horizontal
resolution of (1/12)o, and a 3D baroclinic circulation sub-model for the
Scotian Shelf and the Gulf of St. Lawrence with a horizontal resolution of
(1/16)o, respectively. The other three sub-models of the NCOPS-LB include an
intermediate-resolution (1.1 km) sub-model for the inner Scotian Shelf; a
finer-resolution (500 m) sub-model for a three-bay region of Mahone, Lunenburg
and Lunenburg Bays; and a finest-resolution (180 m) sub-model for Lunenburg Bay
(LB). The NCOPS-LB is forced by astronomical forcing based on WebTide and
meteorological forcing based on 3-hourly weather forecast fields provided by
the Meteorological Service of Canada. A comparison of model results with the
observations made in LB demonstrates that the NCOPS-LB has reasonable skills in
predicting surface elevations, 3D currents, and hydrographic distributions
associated with coastal upwelling/downwelling over the inner Scotian Shelf.
-
Wen-yih Sun
One-Dimensional Sea Ice-Ocean Model Applied to SHEBA Experiment in 1997-1998
Winter by Wen-Yih Sun1, 2 and Jiun-Dar Chern
-
Taiwan Typhoon and Flood Research, Hsin-chu, Taiwan
-
Purdue University, W. Lafayette, IN 47907, USA
Abstract
A one-dimensional snow/sea ice-ocean model with its application to the Arctic
Ocean is presented. The model includes a mixed-layer ocean model, a multi-layer
snow/ice model, and the interfaces.
Numerical simulations of the SHEBA experiment between November 1997 and January
1998 show that net longwave radiation deficit caused cooling of snow/sea ice
and freezing of the sea water beneath the sea ice. The latent heat released
from freezing at ice-water interface was transferred upward through snow/sea
ice with a strong temperature gradient. The atmosphere and sea water also
provided a small amount of sensible heat fluxes to snow/sea ice. The
simulations also show that the accurate snow thickness is crucial to predict
the freezing rate of the sea water beneath. Meanwhile, including ventilation
can increase the heat transfer inside the snow. The results also indicate that
the horizontal advection and drifting of sea ice should be included in the
ocean model to reproduce the observed property of sea water and current
velocity, even though the snow and sea ice are not sensitive to the detailed
profiles of salinity and water temperature. Finally, more observations and
advanced models are needed to simulate the drifting snow and ventilation in the
Arctic realistically.
-
Mei-Ying Lin
Direct numerical simulation of wind-wave generation processes
An air-water coupled model is developed to investigate wind-wave generation
processes at low wind speed where the surface wind stress is about and the
associated surface friction velocities of the air and the water are and ,
respectively. The air-water coupled model satisfies continuity of velocity and
stress at the interface simultaneously, and hence can capture the interaction
between air and water motions. Our simulations show that the wavelength of the
fastest growing waves agrees with laboratory measurements and the wave growth
consists of linear and exponential growth stages as suggested by theoretical
and experimental studies. Constrained by the linearization of the interfacial
boundary conditions, we perform simulations only for a short time period, about
70s; the maximum wave slope of our simulated waves is and the associated wave
age is , which is a slow moving wave. The effects of waves on turbulence
statistics above and below the interface are examined. Sensitivity tests are
carried out to investigate the effects of turbulence in the water, surface
tension, and the numerical depth of the air domain. The growth rates of the
simulated waves are compared to Phillipsˇ¦ (1957) theory for linear growth and
to Plantˇ¦s (1982) experimental data and previous simulations that used a
prescribed wavy surface for exponential growth. In the exponential growth
stage, some of the simulated wave growth rates are comparable to previous
studies, but some are about 2~3 times larger than previous studies. In the
linear growth stage, the simulated wave growth rates for these four simulation
runs are about 1~2 times larger than Phillipsˇ¦ prediction. In qualitative
agreement with the theories proposed by Phillips (1957) and Belcher and Hunt
(1993) for slow moving waves, the mechanisms for the energy transfer from wind
to waves in our simulations are mainly from turbulence-induced pressure
fluctuations in the linear growth stage and due to the in-phase relationship
between wave slope and wave-induced pressure fluctuations in the exponential
growth stage, respectively.
-
Yu-heng Tseng
Modeled Oceanic Response to Hurricane Katrina and Typhoon Kai-tak
Department of Atmospheric Sciences, National Taiwan University, Taipei, Taiwan
Abstract
The ocean response to hurricane Katrina and typhoon Kai-tak is simulated using a 4th-order-accurate basin-scale ocean model. The surface winds in the hurricane Katrina simulation are imposed by an atmospheric hurricane model while the winds in the typhoon Kai-tak are obtained directly from the QuikSCAT satellite images. In the hurricane Katrina response, an intense nonlinear mesoscale eddy is generated with Rossby number O(1) and 50-100km horizontal scale. Instantaneous top layer currents larger than 3-4 m/s occur in the northern Gulf of Mexico. Further, the simulated currents and internal wave speeds in the Gulf of Mexico are comparable to Katrina’s translation speed, which may lead to extra energy absorption by given material elements or by propagating solitary internal waves nearly resonant with the atmosphere. We further explore the ocean response to typhoon Kai-tak. More than 8°K sea surface temperature (SST) drop is found in both observation and simulation. We attribute this significant SST drop to the influence of slow moving typhoon and bathymetrically-induced upwelling in South China Sea.
-
Chris Mooers
Lessons Learned from Quasi-Operational Nowcast/Forecast Systems for Coastal
Ocean Circulation
Christopher N. K. Mooers
Ocean Prediction Experimental Laboratory (OPEL)
Rosenstiel School of Marine and Atmospheric Science
University of Miami, Florida, USA
ABSTRACT
For several years, quasi-operational (i.e., real-time, semi-autonomous,
research-mode) nowcast/forecast systems have been run in two quite different
regimes: (1) the Straits of Florida/East Florida Shelf, which includes the
Florida Current, and (2) Prince William Sound, Alaska, which is a small,
semi-enclosed sea with two major straits. For both regimes, the Princeton Ocean
Model (POM) has been implemented with mesoscale resolution. Both
implementations are forced by mesoscale numerical weather predictions, the U.S.
Navyˇ¦s operational global ocean model (NCOM, which assimilates satellite
altimetric sea surface height anomalies, MCSST, ARGO float temperature &
salinity profiles, etc.) for open boundary conditions, and four diurnal and
four semi-diurnal tides, also imposed on the open boundaries. Mainly real-time
observations are used for model skill assessment, as a prelude to data
assimilation. One of the benefits of this activity has been new understanding
derived form diagnostics studies made possible by these numerical simulations.
For example, the Florida Current Frontal (cyclonic) Eddies, which form weekly
in the cyclonic shear zone along the shelfbreak, have been more fully
characterized than has been possible by observations alone, and the prevalence
of three-layered monthly mean flow in the straits of Prince William Sound has
been determined in a highly variable regime that is difficult to
comprehensively observe.
-
Masafumi Kamachi
Operational Ocean Data Assimilation and Prediction System in JMA and MRI
Masafumi Kamachi, Norihisa Usui, Hiroyuki Tsujino, Yosuke Fujii, Satoshi
Matsumoto and Shiroh Ishizaki
Meteorological Research Institute, 1-1 Nagamine Tsukuba, 305-0052, Japan.
E-mail: mkamachi@mri-jma.go.jp
Tel.: +81-29-853-8657, Fax: +81-29-855-1439
Oral Presentation (Invited)
Recent developments of observing system,modeling and data assimilation method
enable us to estimate and predict ocean stateoperationally.
As a result, seasonal to interannual forecasting, fisheries, marine safety,
offshore industry, management of shelf/coastal areas, security applications,
and improved information for related fields (marine biogeochemical process and
numerical weather prediction) are among the expected beneficiaries of ocean
data assimilation and prediction.
We discuss the current status of operational ocean data assimilation and
prediction in a category ˇ§Ocean Weatherˇ¨ (mesoscale to coastal ocean states).
It is shown how ocean observing systems act as an important role for
understanding ocean phenomena through data assimilation; water mass and its
pathway are analyzed through data assimilation; recent operational predictions
of ocean state are performed; long range variability is analyzed with ocean
analysis/reanalysis. These issues are discussed with examples mainly adopted
from the projects of Meteorological Research Institute (MRI) ocean data
assimilation system MOVE/MRI.COM and its operation in Japan Meteorological
Agency (JMA). Possible future developments are also addressed.
-
Malcolm J. Bowman
Towards a Predictive Storm Surge Modeling System for the Northeastern Seaboard, USA
Malcolm J. Bowman, Frank S. Buonaiuto, Brian A. Colle, Robert E. Hunter and Robert E. Wilson
Storm Surge Research Group
School of Marine and Atmospheric Sciences
State University of New York at Stony Brook
Stony Brook, NY
Presented at the International Workshop for Numerical Ocean Modeling and Prediction
Taipei, Taiwan, April 23-25, 2008
Abstract
The eastern seaboard of the United States is exposed to storm surges from extreme weather events, particularly autumn hurricanes and winter nor’easters. The low-lying coastal zone is vulnerable to coastal flooding with the highest population densities and development found in Metropolitan New York, northeastern New Jersey and Long Island. Much of this region is built on low-lying land, lying less than 3 m above mean sea level. A direct hit by, for example, a category 3 hurricane, land-falling at high tide could cause significant flooding, loss of life, crippling of transportation and communication systems, and huge losses to residential, commercial and industrial properties. Better storm surge numerical models are needed to more accurately predict surges and the resulting inundation expected from major storm events in an era of climate change. Applications include coastal engineering and protection, land planning practices, building code modifications, insurance concerns, and emergency management protocols for evacuation eventualities. The Stony Brook Storm Surge (SBSS) modeling system utilizes surface winds and sea level pressures from the Pennsylvania State University-National Center for Atmospheric Research (PSU-NCAR) mesoscale model (MM5) running at 12-km resolution to drive the Advanced Circulation Model for Coastal Ocean Hydrodynamics (ADCIRC). ADCIRC runs on an unstructured grid with resolutions ranging from ~ 70 km far offshore to ~5 m in the constricted inlets and tributaries of New York Harbor, southern Long Island and northeastern New Jersey.
SBSS produces daily surge predictions, with a 48-hour time horizon, at 13 coastal locations (coincident with NOAA primary tidal stations), which are compared with observed and astronomical tides, as well as surface winds and sea level pressures at 10 offshore NOAA buoy locations. Results are presented on the Web at <http://stormy.msrc.sunysb.edu>.
The setup of SBSS and examples of model skill are presented for several archetypical storms (nor’easters and extra tropical storms) that have impacted Metropolitan New York and Long Island over the last quarter century. Current efforts are focused on increasing prediction accuracy, in particular by developing and applying a moving, high-resolution, vortex-tracking MM5 grid to better characterize winds and sea level pressures, and thus waves and wind-driven ocean surface currents in the interior of rapidly propagating hurricanes.
-
Keith Thompson
Forecasting Mesoscale Variability of the North Atlantic Using an Efficient,
Physically-Motivated Scheme for Assimilating Data
Keith Thompson and Yimin Liu
Dalhousie University
A computationally-efficient scheme is described for assimilating sea level
measured by altimeters and vertical profiles of temperature and salinity
measured by Argo floats. The scheme is based on a transformation of
temperature, salinity and sea level into a new set of physically-motivated
variables for which it is easier to specify spatial covariance functions. The
scheme allows for sequential correction of temperature and salinity biases, and
online estimation of time-dependent background error covariance parameters. Two
North Atlantic applications, both focused on predicting mesoscale variability,
are used to assess the effectiveness of the scheme. In the first application
the background field is a monthly temperature and salinity climatology and
skill is assessed by how well the scheme can recover Argo profiles that have
not been assimilated. In the second application the backgrounds are forecasts
made by an eddy-permitting model of the North Atlantic. Skill is assessed by
the quality of forecasts with lead times of 1 to 60 days. For both applications
it is shown that the scheme has useful skill. The benefits of using physical
constraints to reduce the computational cost of assimilation will be discussed
in general, and compared to other cost-reducing approaches such as those used
in the SEEK filter.
-
Avichal Mehra
Real time Ocean Forecast System (RTOFS): A high resolution operational ocean
forecast system for the Atlantic
RTOFS (Atlantic) is the _rst in a series of operational ocean forecast systems
based on HYCOM (HYbrid Coordinate Ocean Model). This system is a result of
collaborative e_orts among the University of Miami, the Naval Research
Laboratory (NRL), and the Los Alamos National Laboratory (LANL), as part of the
multi-institutional HYCOM Consortium. This Consortium for Data Assimilative
Ocean Modeling was funded by the National Ocean Partnership Program (NOPP) to
develop and evaluate a data-assimilative hybrid isopycnal-sigma-pressure
(generalized) coordinate ocean model. The unique needs of this operational
system at NCEP dictates that the ocean model needs to be versatile enough to
capture processes at di_erent length and spatial scales, from the coastal ocean
to strati_ed deep ocean. Hence, both the horizontal and vertical resolution
needs to be adequate to resolve phenomena at multiple scales. It is widely
believed that while the deep strati_ed ocean is best represented by the
isopycnal coordinate (i.e. using density to track the vertical coordinate),
constant z-levels (or constant pressure levels) are best in representing the
upper mixed layer in the surface while the terrain-following sigma coordinate
is often the best choice in coastal regions (Chassignet et al, 2006). HYCOM can
be con_gured to combine all three approaches by choosing the optimal
distribution of vertical coordinates at every time step. The hybrid coordinates
can be con_gured such that a dynamically smooth transition can be made from the
sigma coordinates in the coastal ocean to pressure coordinates in the surface
mixed layer and isopycnal layers in the deep ocean. Further details of this
hybrid scheme can be found in Bleck (2002). For applications at NCEP, the ocean
near the US east coast needs to be well resolved along with the ability to
obtain the water mass characteristics as well as currents in the deep. This is
a great challenge as the computational resources dictate a limited number of
vertical levels that can be used. _National Centers for Environmental
Prediction, Camp Springs, MD ySAIC/National Centers for Environmental
Prediction, Camp Springs, MD
RTOFS in the Atlantic Ocean is an NCEP operational ocean forecast system based
on HYCOM on a 1200 _ 1684 orthogonal grid with 26 vertical coordinates composed
of 21- isopycnal and 5-level coordinates. It is forced with winds, heat ux,
evaporation and precipitation every 3 hour (derived from NCEP's global
atmospheric GFS [Global Forecast System]). River outows with USGS daily stream
ows and RIVDIS climatology are included along with body and boundary tides. The
model assimilates 1. SST from GOES, AVHRR, and in-situ; 2. SSH from JASON, GFO
and ENVISAT; and 3. T/S from ARGOS and CTD. The model is run once a day. Each
run produces sets of 24-hour nowcast and 120-hour forecasts. The main goal of
this development is to establish an operational highresolution ocean forecast
system for short-term, O(1 week) predictions for the Atlantic sector
(26_S??76_N) covering both shallow and deep waters. It produces nowcasts and
forecasts of sea levels, currents, temperatures, and salinity. The model
evaluation and veri_cation has been performed with an emphasis on the US east
coast, Gulf of Mexico and the Gulf Stream regions. These areas are important to
provide seamless boundary and initial conditions to other operational and
semi-operational regional ocean physical and biogeochemical models. Other near
future applications of this forecast system include coupled atmosphere-ocean
hurricane forecasts and coupled circulation-wave ocean models with one-way and
two-way interactions.
Impacts on results of some recent upgardes to algorithms and data inputs will
also be presented.
References
[1] Bleck, R., 2002. An oceanic general circulation model framed in hybrid
isopycnic-cartesian coordinates. Ocean Modelling, 4, 55-88.
[2] Chassignet, E. P, Hurlbert, H. E., Smedstad, O. M., Halliwell, G.
R.,Wallcraft,
A. J., Metzger, E. J., Blanton, B. O., Lozano, C. J., Rao, D. B., Hogan, P. J.
and Srinivasan, A, 2006. Generalized vertical coordinates for eddy resolving
global and coastal ocean forecasts. Oceanography, 19, 1.2
Poster Presentation
- Peter Chu
Transformed Flux-form Semi-Lagrangian Schemes for Ocean Modeling
Peter C. Chu and Chenwu Fan
Naval Ocean Analysis and Prediction Laboratory
Department of Oceanography, Naval Postgraduate School
Monterey, CA 93943, USA
Tel: 831-656-3688, Fax: 831-656-3686, Email: pcchu@nps.edu
Abstract
..Transformed flux-form semi-Lagrangian (TFSL) scheme provides stable and accurate algorithm to solve the advection-diffusion equation. Different from the existing flux-form semi-Lagrangian schemes, the flux at boundary of grid cell is treated as the temporal mean between present and next time steps. After the temporal-spatial transformation using the characteristic-line concept, the temporal integration of the flux from present to next time step becomes the spatial integration of the flux at the present time step. This scheme is always stable even for large Courant numbers (> 20) with the second order accuracy in both time and space. For the Courant number not larger than 0.5, the TFSL scheme reduces to the Lax-Wendroff explicit scheme. The capability of the TFSL scheme is demonstrated in simulating propagation of the equatorial Rossby soliton.
Key Words: TFSL scheme, flux-form semi-Lagrangian scheme, characteristic line, advection-diffusion equation, finite volume, conservative finite difference, Courant number, equatorial Rossby soliton.
- SUNG HYUP YOU
Storm Surges Prediction using Ocean Forecast System in KMA
SUNG HYUP YOU*
Global Environment System Research Laboratory,
National Institute of Meteorological Research/KMA, Korea
shyou@metri.re.kr, shyou@kma.go.kr
Tel : +82-2-6712-0361
Fax: +82-2-841-2787
The coastal areas of Korean peninsular are one of the challenging places in ocean modeling for reasonable prediction of nearshore storm surges/tide conditions. During summertime, the number of typhoons occurs in the Pacific Ocean and pass adjacent to the Korean Peninsula, often causing terrible damage to property in the coastal region. Establishing of newly devised ocean prediction system of Korea Meteorological Administration (KMA) is underway in conjunction with high computing environment. The main focus of storm surges prediction system lies in accommodating regional and coastal storm surges processes.
The Storm Surge/tide Operational Model (STORM) in KMA covers 115?150°E, 20?52°N based on POM (Princeton Ocean Model) (Blumberg and Mellor, 1987) with 1/12?horizontal resolutions including the Yellow Sea, East China Sea and the East Sea, marginal seas around Korea. From July, 2006 the STORM have been applied to formal forecasting model in KMA based on CRAY X1E system. Sea surface wind and pressure from the Regional Data Assimilation and Prediction System (RDAPS) is used for forcing input of storm surge model. In this model, the level of storm surge calculated by the difference between tide level and sea level change caused by meteorological effects.
In the near future, ultra-high resolution coastal storm surges/tide prediction system will be applied operational model in KMA. The developing coastal storm surges/tide model covers 6 coastal areas around Korean peninsular and the horizontal grid intervals are 1/120. for each area. The model output from regional model is used for boundary condition of coastal model. Sea surface wind and pressure predicted from the operational weather forecasting model of KMA are used for forcing input of coastal storm surge model.
The STORM simulates very well the storm surges pattern by approaching Typhoon around Korean Peninsular. The storm surges were hindcasted using pressure and wind field of Typhoon. Using sea level from tidal stations, the operational model was verified. The BIAS and RMSE results of western stations show larger value than other southern and eastern stations. Generally, the seasonal variations generally show low statistical differences between model and observation in summer season and high ones in the winter season.
Futhermore, the coastal storm surges/tide models simulate also very well the storm surges pattern in the complex coastal areas. The result showed that the storm surges by the coastal model was in well agreement with the observed sea level occurred by high tide and storm surges in the coastal areas. The development of high resolution is very essential to predict the storm surges patterns in the complex coastal areas of Korea. The high resolution coastal storm surges/tide prediction system will be used for more precise ocean forecasting in KMA.
- Yang Ho Choi
3-D hydrodynamic and eutrophication model in the west coast of Korea
Yang Ho Choi1, Young Jae Ro2, Chang Su Jeong1 and Hee Dong Jeong1
1 South Sea Fisheries Research Institute, NFRDI , Yeosu, 556-823, Republic of Korea.
E-mail : plumechoi@momaf.go.kr ,Tel.: +82-61-690-8953, FAX : +82-61-686-1588
2 Department of Oceanography, Chungnam National University, Daejeon, 305-764, Republic of Korea
Abstract
This study focused on the development of hydrodynamic and eutrophication model in the semi-enclosed small bay in the west coast of Korea. To investigate the characteristics of water quality distribution and variability in the study area, Monthly hydrographic survey were carried out at 10 stations, collecting temperature, salinity and water quality parameters for the period of 2001-2002. In addition, simultaneously time series records of water quality parameters had been collected by remote sensing and monitoring system with 10-minute sampling interval. The observational results show the characteristic patterns of dissolved oxygen (DO) and formation of hypoxia in bottom water off the embankment and mariculture area in summer.
A 3-dimensional hydrodynamic and water quality model was performed to reproduce the distribution of water quality parameters in the study area using HEM-3D with real oceanographic forcing. The hydrodynamic model results were in good agreement with observation data. The model could reproduce tidal elevation and current with more than 90% accuracy for four major tidal constituents. The Eulerian tidal residuals show that a lot of eddy structures developed around islands and inner parts of the study area due to the complex coastline and irregular bottom topography.
The water quality model was successful in reproducing the distribution of water quality parameters in the study area. The horizontal distribution of salinity show that low salinity water extends southward to the mouth of the bay at low tide, while the area is limited to the northern part of the bay at high tide. The lowest salinity water mass resides the adjacent area to the embankment due to the low speed of flow pattern with less than 0.1 m/s. The horizontal distribution of DO show that the vicinity of the embankment and mariculture area were characterized as low DO concentration, less than 5.0 mg/l, while high concentration, greater than 7 mg/l, at central part of the bay.
The sensitivity analysis using the calibrated model was performed to study the controlling processes for hypoxia in the study area. It shows the DO consumption by the Sediment Oxygen Demand(SOD) is more effective to change the water quality than the Chemical Oxygen Demand (COD) of land based effluents. However, More detailed model study will be needed to understand the physical and biogeochemical processes of water quality variables in the study area. Among those, the influence of the fresh water runoff, pollutants loading from mariculture system and bottom sediment flux will be main focus to develop the water quality prediction model.
References
Park, K., A. Y. Kuo, J. Shen and J. M. Hamrick, 1995. A three-dimensional hydrodynamic eutrophication model (HEM-3D): Description of water quality and sediment process submodels. Special Report in Applied Marine Science and Ocean Engineering No. 327, School of Marine Science, VIMS.
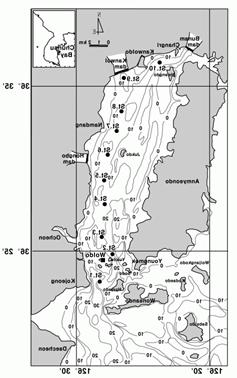 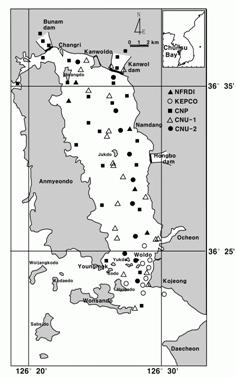
Fig. 1. bathymetry and observation points of the hydrodynamic and water quality parameters in the study area.
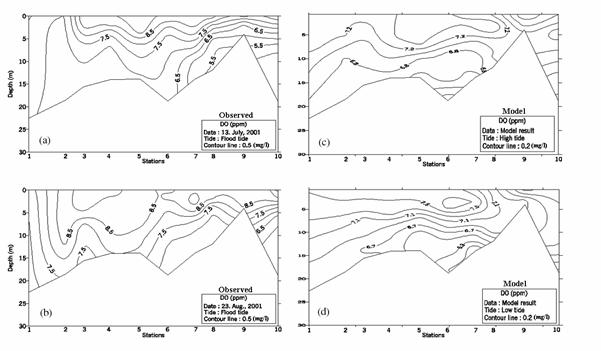
Fig. 2. Verification results of dissolved oxygen along the longitudinal section with observation data in (a) July, (b) August 2001 and (c, d) Model results.
- Young Jae Ro
Hebei Spirit Oil Spill Fate and Trajectory Modeling in the Western Coast of Korea, Yellow Sea
Young Jae Ro, Kwang Young Jung and Chung Ho Lee
Dept. of Oceanography, Chungnam National University,
Taejon, Korea, Yusung-ku, Kung-dong 220, S. Korea, 305-764,
royoungj@cnu.ac.kr Tel: 82-42-821-6437, Fax: 82-42-822-8173
“Hebei Spirit?spilled crude oil of the amount of 10,000 ton on Dec. 7, 2007 off the coast of Taean Peninsula, S. Korea in the Yellow Sea. This spill accident recorded the worst case in the spill history in Korea in terms of the spilled amount, stained coverage area and degree of impact on the local eco-system. In addition, spill clean-up operation has been carried out since the beginning of the accident and recorded over one million voluntary participants from the Korean citizens. Research and Investigation tem have been formed to study the impact of the spill on the marine and coastal environment as well as on the aqua-cultural sites extended over 200 kilometers.
The numerical models are under development to hindcast the spreading and diffusion of the spilled oil to estimate the areal coverage of the spill. In addition, fate model of the spilled oil is also being developed as well to predict the behavior of the oil pollutant in the aquatic and benthic environment.
We are developing various modules for the Hebei Spirit oil spill based on the ECOMSED (http://www.hydroqual.com). Model configuration is as follows; as seen in Fig. 1, first model domain is designed 1x1 degrees to cover the dispersion for the initial 30-day period. The model domain is being expanded to cover the much wider spill coverage. Grid system was designed to resolve nearshore area in fine scales down to 100 meter and offshore area in coarse scales up to several kilometers. Model open boundaries are forced by the 4 major tidal constituents to reproduce tidal current system seen in Fig. 2 where it shows M2 and S2 tidal ellipses.
Reproduced tidal currents are shown in Figs. 3 on the flood and ebb phases. They are directing north-south in the off shore waters, whereas in the inshore waters, they are more rectilinear along the coastline corresponding to the tidal ellipses in Fig 2.
Spreading and diffusion of the Hebei Spirit oil spill will be estimated and their animation will be shown in the presentation. Fate of the spilled oil will be estimated in terms of evaporation/emulsification rates and bottom sedimentation.
Fig. 3 Tidal current at flood and ebb phases.
- Li Zhai
Improving the Utility of a Coastal Circulation Model through Data Assimilation Using a New Scheme Based on the Pressure-Correction Method
Li Zhai and Jinyu Sheng
Department of Oceanography, Dalhousie University, Halifax, NS, B3H 4J1, Canada
A new data assimilation scheme was developed for assimilating moored temperature and salinity observations into a three-dimensional coastal ocean circulation model. This new scheme has two major steps. First, the observations of depth-dependent temperature and salinity at fixed locations are projected onto model grids by a multi-variable regression method to generate analyzed hydrographic fields. Second, a pressure correction term calculated from the difference between the analyzed and model-calculated density fields is assimilated to the model momentum equation. The major advantages of this new scheme are that data assimilation is only applied to the model momentum equation and the model temperature and salinity equations are fully prognostic. The performance of this new data assimilation scheme was assessed using a 2-level nested-grid coastal circulation model for Lunenburg Bay of Nova Scotia, Canada. Our model results demonstrate that this new scheme improves significantly the performance of the coastal circulation model in simulating the water mass movement and circulation over coastal waters in comparison with the purely prognostic calculation without data assimilation.
- Tae Sung Jung
Improving the Utility of a Coastal Circulation Model through Data Assimilation Using a New Scheme Based on the Pressure-Correction Method
Li Zhai and Jinyu Sheng
OperationAl Prediction SYSTem of Coastal Circulation and Pollutant dispersion IN COASTAL region
Professor Tae Sung Jung1 , Department of Civil & Environmental Engineering, Hannam University, Ojung-dong 133. Daeduk-gu, Daejeon 306-791, S. Korea.
Coastal development such as port and harbor construction, reclamation, and dredging has been conducting in coastal region. The development has caused many environmental problems and is exposed to coastal disaster. In finding out the countermeasures for water quality management and coastal disaster prevention, it is necessary to grasp change of coastal circulation and water quality in real-time. Coastal development project induces the growth of population in coastal zone and increases pollutant load into the coastal waters. After completing the construction, frequency of ship navigation will increase. That will be a source of oil spill. As an example, in December of 2007, a great oil spill accident occurred in the western coast of Korea and caused big environmental damages to coastal region. To prevent these disasters, coastal environmental parameters such as currents, tide, and water quality change should be predicted and serviced to data user groups quickly and precisely.
An operational prediction system of coastal circulation and pollutant transport has been developed to service coastal environmental information in real-time. The system consists of pre-processing module for modeling control, modeling engines of simulating coastal environmental parameters, and post-processing module of displaying modeling results and monitoring data. The present modeling system includes a 2-dimentioanal and 3-dimensional hydrodynamic model to predict the sea level and currents in coastal region and an advection-diffusion model to simulate pollutant transport such as SS, COD. First, the real-time measured data of field observation devices transmitted from observation devices to the server computer with PCS phone or cellular phone. Number of field observation points is limited because of too much expense and time in measuring environmental parameters in field. Numerical modeling of time and spatial variations of sea level, currents and water quality is included in the system to back up the spatially insufficient monitoring data. The predicted results by numerical models are compared with the observations to minimize the simulation errors. The simulation results are assimilated with field observations. The corrected final simulation results are serviced to information user groups in digital and graphic form.
An operational prediction system integrating monitoring and modeling has been developed successfully. The automatic tuning system included in the system operated well and the simulated results showed good agreements with the monitored data. Time and spatial variations of the simulated sea level, currents, and pollutant dispersion are provided in graphic and digital form to users that want to obtain exact information about coastal environment quickly. When applying this system in watching out ocean climate change in coastal waters, natural disaster and environmental damage can be decreased. Emergency act plan to protect the forthcoming natural disaster and environmental damage can be prepared efficiently by using this prediction system. Loss of life and property due to late recognition and forecasting of natural disaster can be decreased. In this paper, it was demonstrated that integrated system of modeling and real-time monitoring could be used as a useful tool in conserving coastal environment and lessening natural disaster in coastal region
. email : jungts@hnu.kr
Telephone : 82-42-629-7931, Fax : 82-42-628-3706
- Yu-heng Tseng
National Taiwan University, Taipei, Taiwan, Taiwan; and S. Jan, D. E. Dietrich, and Y. Yang
Seasonal and fortnightly variability of baroclinic tides in the Luzon Strait and
northern South China Sea: a numerical study
A fourth-order, fully two-way-coupled duo-grid Pacific Ocean Model (DUPOM) is developed to simulate the regional circulation around Taiwan and Asian Marginal seas. The model uses 1/4?and 1/8?horizontal resolutions for the western and eastern Pacific Ocean domains, respectively. Many important circulation patterns in the Asian Marginal seas are reproduced, including the variations of Kuroshio path; fluctuation of Kuroshio extension; Kuroshio intrusion and retreat through Luzon Strait and over southern East China Sea; formation of a warm core eddy in northern South China Sea in winter; seasonal variation of circulation in Taiwan Strait, etc.. The dynamic of Kurohsio intrusion into the Luzon and Taiwan Straits is further investigated and analyzed. Bottom topography plays an important role on the generation of coastal eddies and their movements. Seasonal Kuroshio intrusion in the Luzon Strait compares well with observations and indicates a possible three layer structure. The throughflow transport variation in the Taiwan Strait is consistent with the field measurements. Our results verify the year round existence of Kuroshio Branch Water (KBW) in the deep portion of the southeast strait.
- Sen, Jan
National Central University, Jung-li, Taiwan ROC
senjan@ncu.edu.tw
The Conveyor of the Source Water Feeding into Taiwan Strait
Based on the water mass analysis, it has long been proposed that the northern South China Sea (SCS) surface current and the Kuroshio branch current through the Luzon Strait (LS) are the two primary conveyors carrying water mass into the Taiwan Strait (TS) in winter-spring and summer-fall, respectively. However, the inference has rarely been verified with the variation of circulation in the upstream region, i.e. the LS and northern SCS, due to the insufficiency of observed current and hydrographic data. A two-way-nested North Pacific Ocean and East Asian seas model is adopted to examine the conveyor of the source water that feeds in to the TS, particularly from the south. The model results reveal that the near Kuroshio surface current rarely flows directly into the TS from the LS in winter; instead the massive westward intrusion of Kuroshio which forms a loop-like belt and mixes with the water in the northern SCS provides high salinity mixed water into the deep channel in the southeastern TS. In summer, the modeled trajectories indicate that the curved Kuroshio surface current in the LS hardly reaches the southeastern TS. The northeastward-flowing currents on the continental shelf south of China carry the less saline water into and through the Taiwan Strait. The water mass cluster analysis, the model-simulated trajectories and historical trajectories of Argos satellite-tracked drifters lend support to our inference.
- L.W. Wang,, C.M. Tseng, K.K. Liu, G. T.F. Wong, G.C. Gong, I.I. Lin, C.H. Sui and J.J. Hung
Institute of Hydrological & Oceanic Sciences, National Central University, Jhongli, Taoyuan 320, Taiwan; lww@ihs.ncu.edu.tw
Institute of Marine Geology & Chemistry, National Sun Yat-Sen University, Kaohsiung, Taiwan
Institute of Oceanography, National Taiwan University, Taipei, Taiwan
RCEC, Academia Sinica, Nankang, Taipei, Taiwan
Institute of Marine Environmental Chemistry & Ecology, National Taiwan Ocean University, Keelung, Taiwan
Department of Atmospheric Science, National Taiwan University, Taipei, Taiwan
Application of a one-dimensional coupled physical-biogeochemical model for the South East Asia Time-series Station in South China Sea during recent ENSO events
Abstract:
A one-dimensional coupled physical and biogeochemical model is applied to South East Asia Time-series Station (SEATS; 180N, 1160E) in northern South China Sea (SCS) during recent ENSO events between 1997 and 2003. Mellor and Yamada's level-2.5 turbulent closure scheme (1982) is adopted for the physical component of the coupled model. The nitrogen-based biogeochemical component of the coupled model includes four compartments: dissolved inorganic nitrogen (DIN), phytoplankton, zooplankton, and detritus with a variable chlorophyll/phytoplankton ratio according to a photoacclimation scheme (Liu et al., 2002). Driven by heat and momentum fluxes of NCEP reanalysis data, the coupled model reproduces mixed layer depth and the seasonal cycle of upper ocean temperature, even though the simulated sea surface temperature (SST) has a warm bias after six months when model initializes. Besides, the model successfully reproduces the seasonal cycles of surface chlorophyll (S-chl) and integrated primary productivity (IPP) as compared to shipboard observations and SeaWiFS data derived values, but the modeled surface chlorophyll-a displays larger (lower) values in winter (summer) season. Model results also predict the negative anomalies of S-chl and IPP during the winter months (DJF) of the 1997-98 and 2002-03 El Nino conditions. However, the model-predicted strong positive anomalies of S-chl and IPP under the 1998-99 and 1999-2000 La Nina conditions, which brought stronger winds and greater heat losses, are not substantiated by observations. Hydrographic conditions at the SEATS station indicate that, under La Nina conditions, unusual accumulation of warm and nutrient-depleted water occurs in the upper water column. Idealized model simulations further demonstrate that the accumulation may lower or cancel out the effect of stronger mixing. Ocean dynamics needs to be carefully examined during La Nina events. Therefore, the biogeochemical responses of the northern SCS to atmospheric forcing during the recent El Nino/La Nina events are displayed in a highly asymmetrical manner.
- Yi-Cheng Teng, Sen Jan, Shuh-Ji Kao, K.K. Liu
Hydrological characteristics of the Feitsui Reservoir in Northern Taiwan and numerical modeling of hydrodynamics and water quality
Institute of Hydrological Sciences, National Central University, Jhongli, Taiwan 32001.
Research Center for Environmental Changes, Academia Sinca
93625001@cc.ncu.edu.tw, senjan@ncu.edu.tw, sjkao@gate.sinica.edu.tw, kkliu@ntu.edu.tw
Abstract:
The Feitsui Reservoir was built as a primary source for water supply to the Taipei metropolitan area. Therefore, its water quality is a very important hydrological issue. According to the Carlson trophic state index (CTSI) reported by the Taipei Feitsui Reservoir Administration, the water quality has changed gradually from oligo-/meso-trophic condition to meso-/eu-trophic condition in the last ten years. Such a change deserves attention. Because of the increasing threat of eutrophication, we decided to develop a coupled hydrodynamic-water quality model to study the processes governing the motion and quality of water in the reservoir. We hope that our study may lead to the generation of useful information for the management of the Feitsui Reservoir in the future. Prior to the development of the model, we need to compile hydrographic and chemical data from historical records and to conduct field work in order to obtain basic information on the hydrological characteristics of the reservoir.
The historical records and our field data have demonstrated that the water column is strongly stratified is summer, with the maximum difference of water temperature reaching 15 ˘J, and well mixed in winter. Vertical fluctuations of the isotherms are discernible in the upper layer along the main axis in the reservoir. Our numerical experiments show that the fluctuations could have been internal waves resulting from wind forcing. A strong wind with velocity of 10 m/s along the long axis of the reservoir may induce wave motion in the top 30 m within 24 hours. The amplitude of the wave decreases with increasing water depth., Weaker winds with 1/10 the velocity can hardly disturb the water column.
It was observed that colder water existed along the bottom of the upper and the middle reaches of the reservoir after the typhoons and also in the early winter. Numerical experiments have demonstrated that the cold water intrusion can proceed along the bottom of the reservoir starting from the upper reach, but the cold water cannot reach the deepest part of the reservoir within a month, if no water discharge is allowed. By contrast, the bottom water renewal by cold water intrusion is much enhanced, if the water discharge is turned on at the dam.
The space-time distribution of dissolved oxygen (DO) reveals the following pattern. The DO concentration is high in the top 20 m and drops in the middle water column. Significant oxygen deficiency occurs in the bottom layer. The distribution of DO in the reservoir in March is very uniform, indicating strong vertical mixing due to water column overturning in late winter. Using mass balance equations, we are able to evaluate the oxygen inflow, outflow, consumption and production rates. During the study period, the average inflow rate of DO is 95.3 mg/m3/d; the average outflow rate of DO is 93.1 mg/m3/d; the average oxygen production rate in the water column is 16.2 mg/m3/d; the average oxygen consumption rate in the water column is 14.5 mg/m3/d; the average oxygen consumption at the bottom is equivalent to a consumption rate in the water column of 7.1 mg/m3/d; the average oxygen exchange between the surface water and the atmosphere is nearly balanced with a small deficit equivalent to a consumption rate in the water column of 1.1 mg/m3/d.
The parameters evaluated by the mass balance equations prove useful for application to the water quality model. It has been demonstrated that the model developed in this study can simulate important features of oxygen distribution, which is one of the most important water quality indices, in the Feitsui reservoir.
- Yaling, Tsai
The Ocean Response to Typhoon Damrey on the Continental Shelf of the South China Sea
Yaling Tsai, Ching-Sheng Chern and Joe Wang
Institute of Oceanography, National Taiwan University
P. O. Box 23-13, Taipei 106, Taiwan, R.O.C.
E-mail: d90241001@ntu.edu.tw
The interaction of the Hainan Island and the Typhoon Damrey induced circulation on the continental shelf is studied using a three-dimensional primitive equation model. Damrey traveled across northern South China Sea in late September of 2005. Along its track, significant surface cooling (4~5°C) was found on the shelf east of Hainan Island. Enhancement of Chl-a was observed at this cold patch two days after the storm passage. The model results show that the distinct cooling results from the strengthened storm intensity when it passed that area. However, the cold anomaly is never contiguous to the east coast of Hainan Island. A warm anomaly induced by Damrey’s passage along the island’s coast not only survives through the direct impact of the storm, it also blocks the westward spreading of the cold patch. The emergence of such strong warming is due to the flow condition built up before the storm arrives, which is favorable for the storm induced downwelling along the coast. In other words, our model study indicates that the regional geometry, the storm path, and the storm induced circulation on the shelf all contribute to the temperature feature observed to the east of Hainan Island. Remote sensing SST cannot resolve this warming area near the coast, but a low Chl-a filament parallel to the coastline was observed from the satellite measured ocean color products.
- Yi-Chun Kuo
Numerical Study on the Interactions between Mesoscale Eddy and Western Boundary Current (WBC)
Yi-Chun kuo, Ching-Sheng Chern
Institute of Oceanography, National Taiwan University, Taipei, Taiwan
A nonlinear reduced gravity shallow water equation model is used to study the interaction between the boundary current and mesoscale eddy. Model result indicated that both cyclonic and anticyclonic eddy will die quickly as they encountering the western boundary current flow region. However, the ways of their dying are quiet different. For a cyclonic eddy, its kinetic energy will transfer into the mean flow as the eddy is deformed into an ellipse with major axis orientated in the north-western direction. For an anticyclonic eddy, its water masses will be carried away by the mean flow and eventually dies.
|
 |
 |
|
|
|
 |

